DeKalb County Home Sales Report 2016
Kevin Polite, Solid Source Realty, Inc.
HausZwei Homes
404-299-7100
Kevin@HausZweiHomes.com
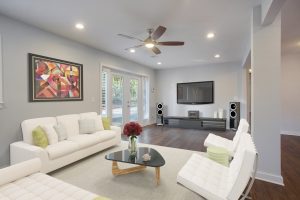
Mid Century Modern Home by HausZwei Homes
DeKalb Market Overview
DeKalb County homes sales had a great year in 2016. There were 10,339 sales of residential homes which was a 6.24% increase from 2015. If you look back to 2007 this is an increase of 15.84% and it appears DeKalb County real estate is back in business and is moving forward.
The median sales price rose 4.84% year-over-year to $220,684. Average price increases over the years is normally 3-4% which means we are finally back to, at least, average growth. This is up 54% from 2011 when we were in the depth of the recession and 15.72% from 10 years.
Length of time on the market is an indicator of a growing real estate market. Overall DeKalb length of time of the market is a surprising 21 days. It’s definitely a seller’s market. Anything below 90 days is fantastic, but 21 days is just about unheard of.
Many of you many think this is a bubble, but the culprit here is the lack of supply of inventory. In 2016 there were 34,168 homes available for sale compared to 55,421 home that were listed for sale in DeKalb County. There just aren’t enough homes for sale on the market to satisfy demand and that in turn increases prices.
DeKalb County home values are greater than what they were 10 years ago, but some zip codes performed considerably better than others, especially in price increases. Over the 10-year period Decatur 30030 which includes both City of Decatur and Midway Woods has increased nearly 37% over the 10 year period. It appears no slowdown is in sight as it increased last year by another 12% and the median home sales price was $435,000 last year.
30319 Brookhaven, 30340 Doraville and 30317 Kirkwood all increased above 25% over the last 10 years and with double digits in the last year.
One bright spot for Central DeKalb was Decatur 30032. It increased 31.48% last year and with neighborhoods such as Belvedere Park and Meadowbrook Acres it has become what many are saying what Midway Woods was 10 years ago. Over the 10 years it only increased 10% but because of the huge number of foreclosures is sustained it had a higher drop in prices during the downturn. This is evidenced by the 73.64% increase from 2012-2016. The highest of any zip code in DeKalb. Homes in that area are now scooped up very quickly in the $150,000-$175,000 range if they have been remodeled. However, because there are still quite a few distressed properties, the median sale price was only $116,750. It has seen a 20% increase in the number of homes sold in the last year.
Sales Prices in the higher end markets such as Virginia Highlands, Druid Hills/Lake Claire and Avondale stayed fairly steady throughout the downturn and therefore haven’t seen wide fluctuations in pricing.
Days on Market and Number of Sales are indication of how healthy a market is. Looking at the graphs shown below you can see that every zip code has less days on the market, which is a good sign. It means homes are being sought after in those areas. Most zip codes have a Days On Market rate of less than 30 days, which is nearly unheard of. Some zip codes are larger than others so you can’t compare the number of sales, but you can compare the size of the percentage change. 30341 Chamblee had the largest 10-year change in number of homes sold with 33.40%, while 30294 Ellenwood had the lowest. It had a -7.19% over the 10-year period.
Summary
DeKalb real estate as a whole is doing well after the recession of the early 2010’s. We had a healthy 4.84% growth last year and fairly flat 15.72% increase over the last 10 years. DeKalb had a 6.24% increase in the number sales last year and 15.84% increase over the past 10 years. Days On Market decreased by -19.05% last year and -171.43% over the past 10 years. This shows were are growing in the right directions. This growth is not distributed evenly throughout the county. The new cities in the northern part of the County remained fairly consistent and saw neither a huge increase nor decrease. The older cities of Central DeKalb such as City of Decatur and gentrifying areas of unincorporated DeKalb such as Kirkwood saw explosive growth. The counties concern is the eastern and southern parts of the county where some zip codes, after 10 years, have median prices below 2007. All of excess inventory has been removed from the market which is why have a very low Days On Market of under 30 days. We have nearly half of as many homes on the market as there were 10 years ago. In fact, we don’t have enough houses to sale, which is leading to price increases in many zip codes of DeKalb.
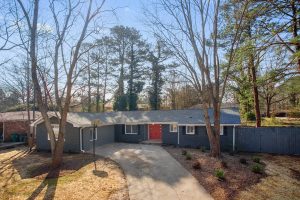
3195 Betty Circle, Decatur 30032
| CHANGE IN SALE PRICE | ||||
| 10 Year Change | 1 Year Change | 5 Year Change | 2016 Median Sales Price | |
| 30088 Stone Mountain | -32.95% | 9.09% | 60.11% | $88,000 |
| 30034 Decatur | -30.38% | 10.58% | 59.64% | $94,950 |
| 30083 Stone Mountain | -18.21% | 23.74% | 60.62% | $104,900 |
| 30038 Lithonia | -7.89% | 24.57% | 60.87% | $115,000 |
| 30032 Decatur | 10.06% | 31.48% | 73.64% | $116,750 |
| 30294 Ellenwood | -28.71% | 4.81% | 50.76% | $132,000 |
| 30087 Stone Mountain | -7.82% | 5.06% | 46.18% | $166,950 |
| 30084 Tucker | 3.82% | 10.05% | 45.13% | $202,750 |
| DEKALB | 15.72% | 4.84% | 54.23% | $220,684 |
| 30340 Doraville | 26.97% | 10.24% | 65.58% | $229,500 |
| 30316 East Atlanta | 25.00% | 17.31% | 54.34% | $260,000 |
| 30033 Decatur | 12.74% | 11.79% | 27.37% | $285,000 |
| 30341 Chamblee | 17.48% | 8.20% | 38.52% | $305,000 |
| 30360 Dunwoody_Doraville | 16.64% | 13.16% | 44.83% | $329,900 |
| 30317 Kirkwood | 30.78% | 13.11% | 58.10% | $339,500 |
| 30002 Avondale | 20.75% | 11.25% | 41.78% | $368,450 |
| 30345 Northlake_Briarcliff | 8.18% | 11.69% | 31.17% | $385,000 |
| 30307 Druid Hills_Lake Claire | 22.15% | -1.90% | 21.52% | $395,000 |
| 30338 Dunwoody | 2.57% | 4.76% | 31.08% | $399,000 |
| 30030 Decatur | 36.99% | 12.01% | 20.00% | $435,000 |
| 30319 Brookhaven | 25.56% | 10.89% | 30.00% | $450,000 |
| 30306 Virginia Highland | 13.40% | 6.52% | 18.58% | $534,900 |
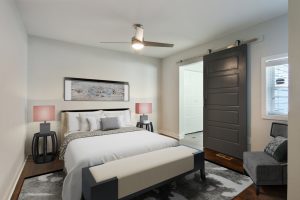
3453 Wren Rd Decatur 30032
| CHANGE IN NUMBER OF TOTAL RESIDENTIAL SALES | ||||
| 10 Year Change | 1 Year Change | 5 Year Change | 2016 No. of Sales | |
| 30002 Avondale | 48.03% | 22.37% | 42.76% | 152 |
| 30294 Ellenwood | -7.19% | 18.95% | -43.14% | 153 |
| 30360 Dunwoody_Doraville | 26.67% | 10.30% | 24.85% | 165 |
| 30306 Virginia Highland | 23.28% | -11.64% | 34.92% | 189 |
| 30340 Doraville | 22.54% | 4.51% | 22.54% | 244 |
| 30345 Northlake_Briarcliff | 14.83% | -8.83% | 23.97% | 317 |
| 30088 Stone Mountain | 12.19% | 24.38% | 10.31% | 320 |
| 30087 Stone Mountain | 9.03% | 17.13% | -8.10% | 321 |
| 30307 Druid Hills_Lake Claire | 13.01% | -1.63% | 26.02% | 369 |
| 30317 Kirkwood | 15.11% | -9.83% | 18.71% | 417 |
| 30038 Lithonia | 16.24% | 34.35% | -2.59% | 425 |
| 30034 Decatur | 6.06% | 18.88% | 23.00% | 429 |
| 30084 Tucker | 15.81% | -10.47% | 27.39% | 449 |
| 30083 Stone Mountain | -9.43% | 8.11% | -19.74% | 456 |
| 30341 Chamblee | 33.40% | 11.79% | 24.75% | 509 |
| 30338 Dunwoody | 28.21% | -7.29% | 14.20% | 521 |
| 30316 East Atlanta | 29.25% | 11.90% | 26.19% | 588 |
| 30030 Decatur | 8.35% | -1.73% | 32.64% | 635 |
| 30033 Decatur | 22.31% | 1.35% | 35.18% | 668 |
| 30032 Decatur | 4.87% | 21.09% | 30.68% | 678 |
| 30319 Brookhaven | 13.57% | -0.12% | 32.13% | 862 |
| DEKALB | 15.84% | 6.24% | 17.37% | 10,339 |
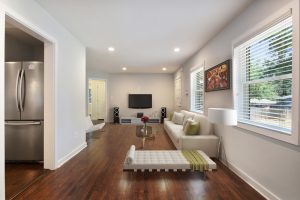
3453 Wren Rd Decatur 30032
| DAYS ON MARKET | ||||
| 10 Year Change | 1 Year Change | 5 Year Change | 2016 Days On Market | |
| 30340 Doraville | -333.33% | -50.00% | -266.67% | 12 |
| 30317 Kirkwood | -283.33% | -25.00% | -200.00% | 12 |
| 30033 Decatur | -291.67% | -141.67% | -391.67% | 12 |
| 30341 Chamblee | -284.62% | -30.77% | -323.08% | 13 |
| 30307 Druid Hills_Lake Claire | -300.00% | -61.54% | -338.46% | 13 |
| 30360 Dunwoody_Doraville | -193.33% | -73.33% | -353.33% | 15 |
| 30316 East Atlanta | -273.33% | -53.33% | -173.33% | 15 |
| 30030 Decatur | -194.12% | -17.65% | 20.47% | 17 |
| 30345 Northlake_Briarcliff | -211.11% | -38.89% | -183.33% | 18 |
| 30084 Tucker | -250.00% | -38.89% | -172.22% | 18 |
| 30338 Dunwoody | -183.33% | -16.67% | -172.22% | 18 |
| 30319 Brookhaven | -147.37% | -5.26% | -136.84% | 19 |
| DeKalb County | -171.43% | -19.05% | -104.76% | 21 |
| 30306 Virginia Highland | -168.18% | -40.91% | -59.09% | 22 |
| 30032 Decatur | -159.09% | -40.91% | -68.18% | 22 |
| 300002 Avondale | -169.57% | 13.04% | -160.87% | 23 |
| 30083 Stone Mountain | -142.31% | -23.08% | -46.15% | 26 |
| 30087 Stone Mountain | -125.81% | -16.13% | -77.42% | 31 |
| 30034 Decatur | -106.25% | -6.25% | -9.38% | 32 |
| 30088 Stone Mountain | -77.78% | 13.89% | 0.00% | 36 |
| 30038 Lithonia | -71.43% | 7.14% | 0.00% | 42 |
| 30294 Ellenwood | -54.55% | 13.64% | 0.00% | 44 |
This information is deemed reliable but not guaranteed. It was sourced from FMLS. Data was pulled only for property sales in DeKalb County, therefore if a zip code was partially in another County, sales in that area not in DeKalb were not counted.
DeKalb County Home Sales Report 2016
Kevin Polite, Solid Source Realty, Inc.
HausZwei Homes
404-299-7100
Kevin@HausZweiHomes.com
« Back to Home Page
